Energy Saving
See where energy goes — and what to adjust.
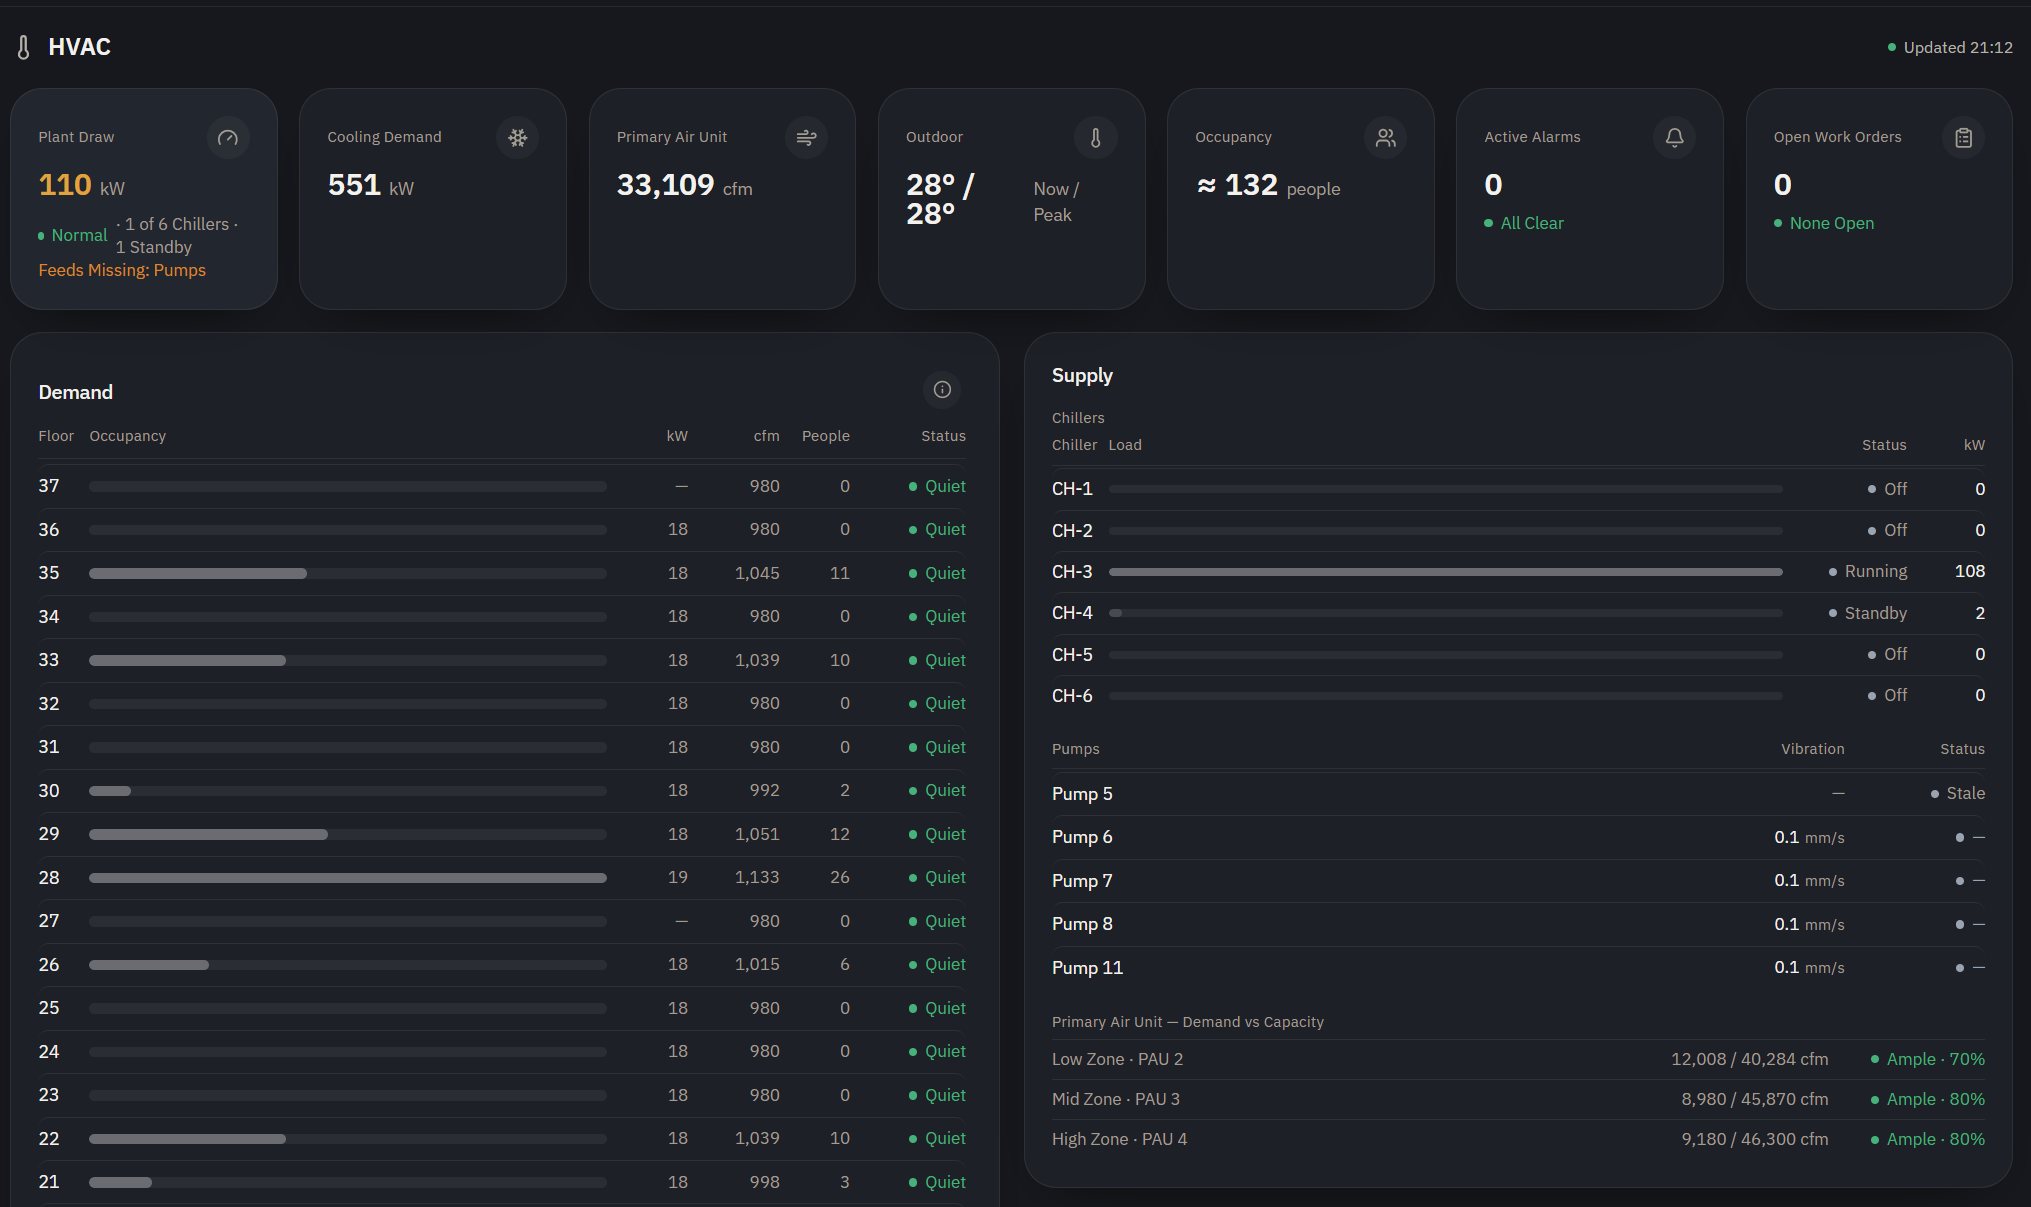
Cooling demand, plant supply, occupancy and advisories in one operational view — with energy and carbon tracked against benchmarks.
What it does
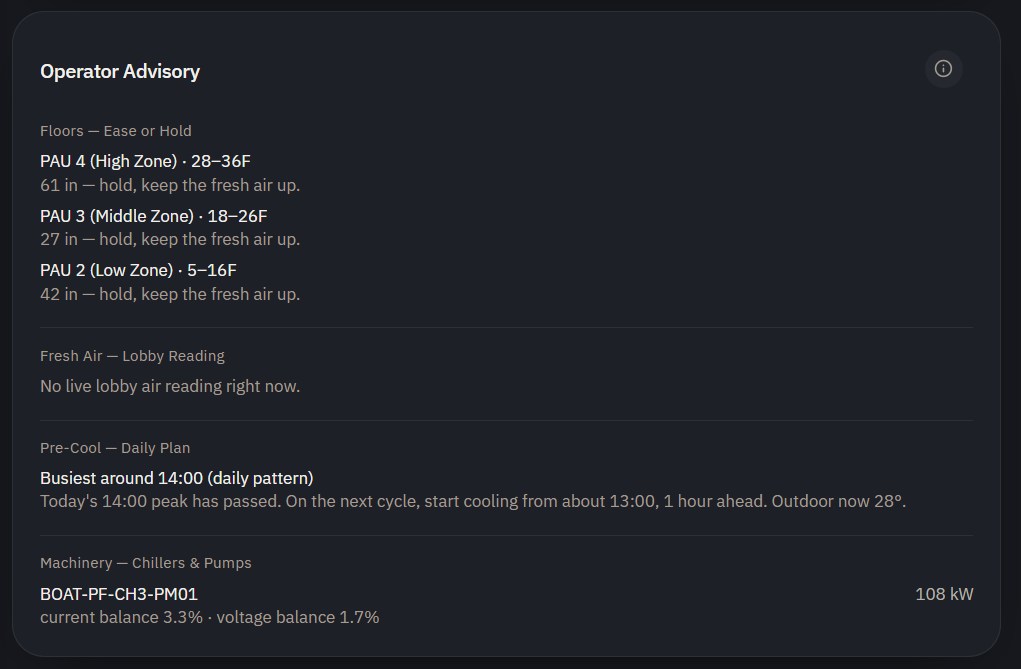
Demand against supply, floor by floor — with concrete advisories and benchmarked results.
How it works
Measure performance
Track energy performance across buildings and periods.
Find opportunities
Identify where operational performance can improve.
Verify improvement
Follow performance over time and confirm results.
What you get
Portfolio visibility
Compare energy performance across buildings.
Actionable opportunities
See where performance can improve.
Measurable progress
Track operational improvement over time.
Performance you can point at
Monthly energy and carbon per square metre — actual against estimate and benchmark, per portfolio or building.
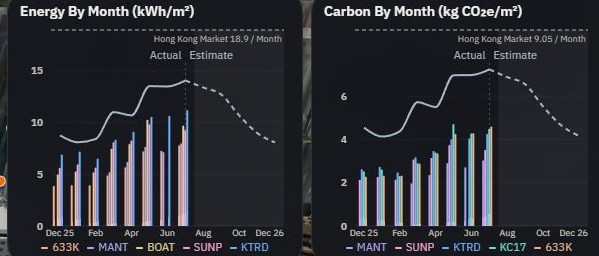
Example demonstration data from the WE Control demo environment.